Main Content


note: the design and colors have been the basis for a number of other flags, including Chile, Liberia, Malaysia, and Puerto Rico


Agency Copyright Notice

Agency Copyright Notice

Agency Copyright Notice

Agency Copyright Notice

Agency Copyright Notice

Agency Copyright Notice

Agency Copyright Notice

Agency Copyright Notice

Agency Copyright Notice

Agency Copyright Notice

Agency Copyright Notice

Agency Copyright Notice

Agency Copyright Notice

Agency Copyright Notice

Agency Copyright Notice

Agency Copyright Notice

Agency Copyright Notice

Agency Copyright Notice

Agency Copyright Notice

Agency Copyright Notice

Agency Copyright Notice

Agency Copyright Notice

Agency Copyright Notice

Agency Copyright Notice

Agency Copyright Notice

Agency Copyright Notice

Agency Copyright Notice

Agency Copyright Notice

Agency Copyright Notice

Agency Copyright Notice

Agency Copyright Notice

Agency Copyright Notice

Agency Copyright Notice

Agency Copyright Notice

Agency Copyright Notice

Agency Copyright Notice

Agency Copyright Notice

Agency Copyright Notice

Agency Copyright Notice

Agency Copyright Notice

Agency Copyright Notice

Agency Copyright Notice

Agency Copyright Notice

Agency Copyright Notice

Agency Copyright Notice

Agency Copyright Notice

Agency Copyright Notice

Agency Copyright Notice

Agency Copyright Notice

Agency Copyright Notice

Agency Copyright Notice

Agency Copyright Notice

Agency Copyright Notice

Agency Copyright Notice

Agency Copyright Notice

Agency Copyright Notice

Agency Copyright Notice

Agency Copyright Notice

Agency Copyright Notice

Agency Copyright Notice

Agency Copyright Notice

Agency Copyright Notice

Agency Copyright Notice

Agency Copyright Notice

Agency Copyright Notice

Agency Copyright Notice

Agency Copyright Notice

Agency Copyright Notice

Agency Copyright Notice

Agency Copyright Notice

Agency Copyright Notice

Agency Copyright Notice

Agency Copyright Notice

Agency Copyright Notice

Agency Copyright Notice

Agency Copyright Notice

Agency Copyright Notice

Agency Copyright Notice

Agency Copyright Notice

Agency Copyright Notice

Agency Copyright Notice

Agency Copyright Notice

Agency Copyright Notice

Agency Copyright Notice

Agency Copyright Notice

Agency Copyright Notice

Agency Copyright Notice

Agency Copyright Notice

Agency Copyright Notice

Agency Copyright Notice

Agency Copyright Notice

Agency Copyright Notice

Agency Copyright Notice

Agency Copyright Notice

Agency Copyright Notice

Agency Copyright Notice

Agency Copyright Notice

Agency Copyright Notice

Agency Copyright Notice

Agency Copyright Notice

Agency Copyright Notice

Agency Copyright Notice

Agency Copyright Notice

Agency Copyright Notice

Agency Copyright Notice

Agency Copyright Notice

Agency Copyright Notice

Agency Copyright Notice

Agency Copyright Notice

Agency Copyright Notice

Agency Copyright Notice

Agency Copyright Notice

Agency Copyright Notice

Agency Copyright Notice

Agency Copyright Notice

Agency Copyright Notice

Agency Copyright Notice

Agency Copyright Notice

Agency Copyright Notice

Agency Copyright Notice

Agency Copyright Notice

Agency Copyright Notice

Agency Copyright Notice

Agency Copyright Notice

Agency Copyright Notice

Agency Copyright Notice

Agency Copyright Notice

Agency Copyright Notice

Agency Copyright Notice

Agency Copyright Notice

Agency Copyright Notice

Agency Copyright Notice

Agency Copyright Notice

Agency Copyright Notice

Agency Copyright Notice

Agency Copyright Notice

Agency Copyright Notice

Agency Copyright Notice

Agency Copyright Notice

Agency Copyright Notice

Agency Copyright Notice

Agency Copyright Notice

Agency Copyright Notice

Agency Copyright Notice

Agency Copyright Notice

Agency Copyright Notice

Agency Copyright Notice

Agency Copyright Notice

Agency Copyright Notice

Agency Copyright Notice

Agency Copyright Notice

Agency Copyright Notice

Agency Copyright Notice

Agency Copyright Notice

Agency Copyright Notice

Agency Copyright Notice

Agency Copyright Notice

Agency Copyright Notice

Agency Copyright Notice

Agency Copyright Notice

Agency Copyright Notice

Agency Copyright Notice

Agency Copyright Notice

Agency Copyright Notice

Agency Copyright Notice

Agency Copyright Notice

Agency Copyright Notice

Agency Copyright Notice

Agency Copyright Notice

Agency Copyright Notice

Agency Copyright Notice

Agency Copyright Notice

Agency Copyright Notice

Agency Copyright Notice

Agency Copyright Notice

Agency Copyright Notice

Agency Copyright Notice

Agency Copyright Notice

Agency Copyright Notice

Agency Copyright Notice

Agency Copyright Notice

Agency Copyright Notice

Agency Copyright Notice

Agency Copyright Notice

Agency Copyright Notice

Agency Copyright Notice

Agency Copyright Notice

Agency Copyright Notice

Agency Copyright Notice

Agency Copyright Notice

Agency Copyright Notice

Agency Copyright Notice

Agency Copyright Notice

Agency Copyright Notice

Agency Copyright Notice

Agency Copyright Notice

Agency Copyright Notice

Agency Copyright Notice

Agency Copyright Notice

Agency Copyright Notice

Agency Copyright Notice

Agency Copyright Notice

Agency Copyright Notice

Agency Copyright Notice

Agency Copyright Notice

Agency Copyright Notice

Agency Copyright Notice

Agency Copyright Notice

Agency Copyright Notice

Agency Copyright Notice

Agency Copyright Notice

Agency Copyright Notice

Agency Copyright Notice

Agency Copyright Notice

Agency Copyright Notice

Agency Copyright Notice

Agency Copyright Notice

Agency Copyright Notice

Agency Copyright Notice

Agency Copyright Notice

Agency Copyright Notice

Agency Copyright Notice

Agency Copyright Notice

Agency Copyright Notice

Agency Copyright Notice

Agency Copyright Notice

Agency Copyright Notice

Agency Copyright Notice

Agency Copyright Notice

Agency Copyright Notice

Agency Copyright Notice

Agency Copyright Notice

Agency Copyright Notice

Agency Copyright Notice

Agency Copyright Notice

Agency Copyright Notice

Agency Copyright Notice

Agency Copyright Notice

Agency Copyright Notice

Agency Copyright Notice

Agency Copyright Notice

Agency Copyright Notice

Agency Copyright Notice

Agency Copyright Notice

Agency Copyright Notice

Agency Copyright Notice

Agency Copyright Notice

Agency Copyright Notice

Agency Copyright Notice

Agency Copyright Notice

Agency Copyright Notice

Agency Copyright Notice

Agency Copyright Notice

Agency Copyright Notice

Agency Copyright Notice

Agency Copyright Notice

Agency Copyright Notice

Agency Copyright Notice

Agency Copyright Notice

Agency Copyright Notice

Agency Copyright Notice

Agency Copyright Notice

Agency Copyright Notice

Agency Copyright Notice

Agency Copyright Notice

Agency Copyright Notice

Agency Copyright Notice

Agency Copyright Notice

Agency Copyright Notice

Agency Copyright Notice

Agency Copyright Notice

Agency Copyright Notice

Agency Copyright Notice

Agency Copyright Notice

Agency Copyright Notice

Agency Copyright Notice

Agency Copyright Notice

Agency Copyright Notice

Agency Copyright Notice

Agency Copyright Notice

Agency Copyright Notice

Agency Copyright Notice

Agency Copyright Notice

Agency Copyright Notice

Agency Copyright Notice

Agency Copyright Notice

Agency Copyright Notice

Agency Copyright Notice

Agency Copyright Notice

Agency Copyright Notice

Agency Copyright Notice

Agency Copyright Notice

Agency Copyright Notice

Agency Copyright Notice

Agency Copyright Notice

Agency Copyright Notice

Agency Copyright Notice

Agency Copyright Notice

Agency Copyright Notice

Agency Copyright Notice

Agency Copyright Notice

Agency Copyright Notice

Agency Copyright Notice

Agency Copyright Notice

Agency Copyright Notice

Agency Copyright Notice

Agency Copyright Notice

Agency Copyright Notice

Agency Copyright Notice

Agency Copyright Notice

Agency Copyright Notice

Agency Copyright Notice

Agency Copyright Notice

Agency Copyright Notice

Agency Copyright Notice

Agency Copyright Notice

Agency Copyright Notice

Agency Copyright Notice

Agency Copyright Notice

Agency Copyright Notice

Agency Copyright Notice

Agency Copyright Notice

Agency Copyright Notice

Agency Copyright Notice

Agency Copyright Notice

Agency Copyright Notice

Agency Copyright Notice

Agency Copyright Notice

Agency Copyright Notice

Agency Copyright Notice

Agency Copyright Notice

Agency Copyright Notice

Agency Copyright Notice

Agency Copyright Notice

Agency Copyright Notice

Agency Copyright Notice

Agency Copyright Notice

Agency Copyright Notice

Agency Copyright Notice

Agency Copyright Notice

Agency Copyright Notice

Agency Copyright Notice

Agency Copyright Notice

Agency Copyright Notice

Agency Copyright Notice

Agency Copyright Notice

Agency Copyright Notice

Agency Copyright Notice

Agency Copyright Notice

Agency Copyright Notice

Agency Copyright Notice

Agency Copyright Notice

Agency Copyright Notice

Agency Copyright Notice

Agency Copyright Notice

Agency Copyright Notice

Agency Copyright Notice

Agency Copyright Notice

Agency Copyright Notice

Agency Copyright Notice

Agency Copyright Notice
-
Introduction :: United States
-

Britain's American colonies broke with the mother country in 1776 and were recognized as the new nation of the United States of America following the Treaty of Paris in 1783. During the 19th and 20th centuries, 37 new states were added to the original 13 as the nation expanded across the North American continent and acquired a number of overseas possessions. The two most traumatic experiences in the nation's history were the Civil War (1861-65), in which a northern Union of states defeated a secessionist Confederacy of 11 southern slave states, and the Great Depression of the 1930s, an economic downturn during which about a quarter of the labor force lost its jobs. Buoyed by victories in World Wars I and II and the end of the Cold War in 1991, the US remains the world's most powerful nation state. Since the end of World War II, the economy has achieved relatively steady growth, low unemployment and inflation, and rapid advances in technology.
-
Geography :: United States
-
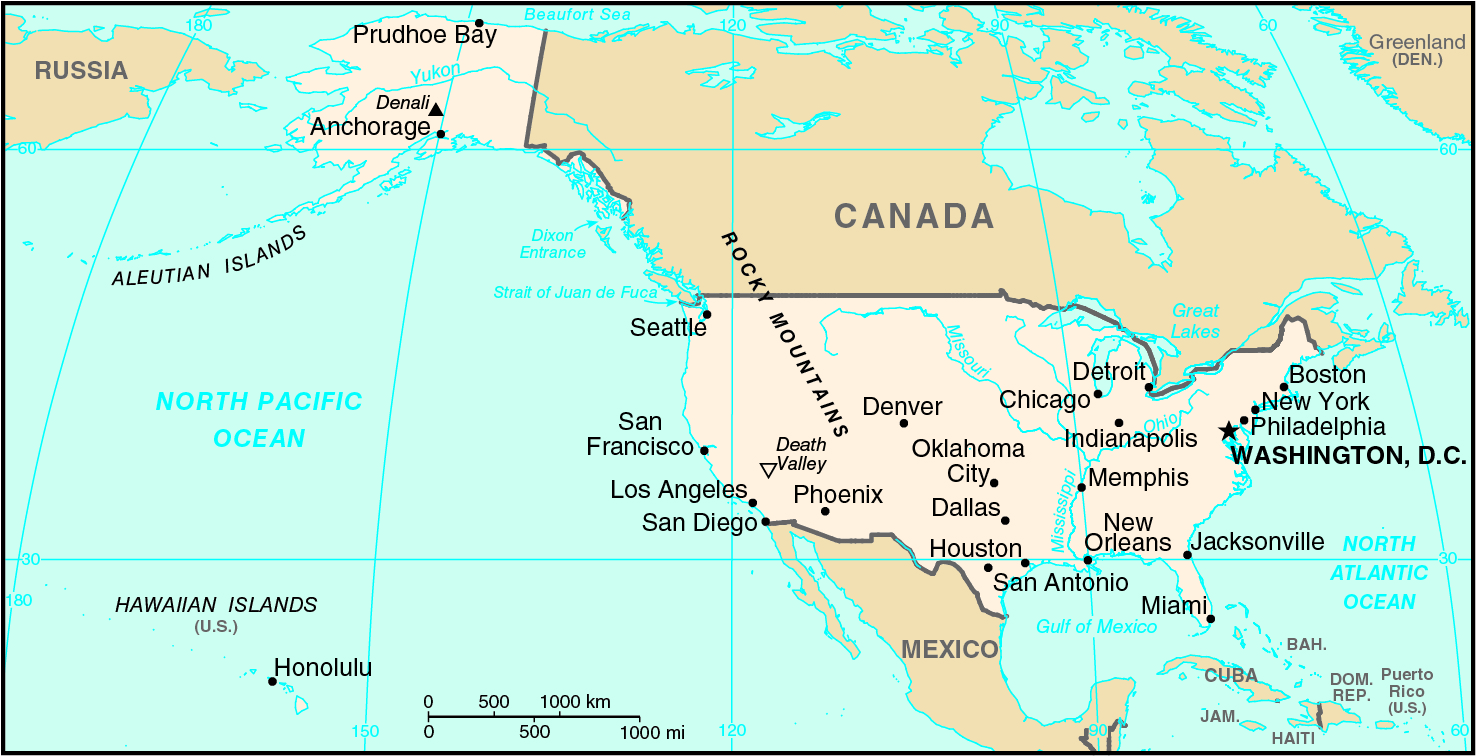
North America, bordering both the North Atlantic Ocean and the North Pacific Ocean, between Canada and Mexico
38 00 N, 97 00 W
North America
total: 9,833,517 sq kmland: 9,147,593 sq kmwater: 685,924 sq km
note: includes only the 50 states and District of Columbia, no overseas territories
country comparison to the world: 4
about half the size of Russia; about three-tenths the size of Africa; about half the size of South America (or slightly larger than Brazil); slightly larger than China; more than twice the size of the European Union
total: 12,048 kmborder countries (2): Canada 8893 km (including 2477 km with Alaska), Mexico 3155 kmnote: US Naval Base at Guantanamo Bay, Cuba is leased by the US and is part of Cuba; the base boundary is 28.5 km
19,924 km
territorial sea: 12 nmexclusive economic zone: 200 nmcontiguous zone: 24 nmcontinental shelf: not specified
mostly temperate, but tropical in Hawaii and Florida, arctic in Alaska, semiarid in the great plains west of the Mississippi River, and arid in the Great Basin of the southwest; low winter temperatures in the northwest are ameliorated occasionally in January and February by warm chinook winds from the eastern slopes of the Rocky Mountains
vast central plain, mountains in west, hills and low mountains in east; rugged mountains and broad river valleys in Alaska; rugged, volcanic topography in Hawaii
mean elevation: 760 mlowest point: Death Valley (lowest point in North America) -86 mhighest point: Denali 6,190 m (Mount McKinley) (highest point in North America)note: the peak of Mauna Kea (4,207 m above sea level) on the island of Hawaii rises about 10,200 m above the Pacific Ocean floor; by this measurement, it is the world's tallest mountain - higher than Mount Everest (8,850 m), which is recognized as the tallest mountain above sea level
coal, copper, lead, molybdenum, phosphates, rare earth elements, uranium, bauxite, gold, iron, mercury, nickel, potash, silver, tungsten, zinc, petroleum, natural gas, timber, arable land, note, the US has the world's largest coal reserves with 491 billion short tons accounting for 27% of the world's total
agricultural land: 44.5% (2011 est.)arable land: 16.8% (2011 est.) / permanent crops: 0.3% (2011 est.) / permanent pasture: 27.4% (2011 est.)forest: 33.3% (2011 est.)other: 22.2% (2011 est.)
264,000 sq km (2012)
large urban clusters are spread throughout the eastern half of the US (particularly the Great Lakes area, northeast, east, and southeast) and the western tier states; mountainous areas, principally the Rocky Mountains and Appalachian chain, deserts in the southwest, the dense boreal forests in the extreme north, and the central prarie states are less densely populated; Alaska's population is concentrated along its southern coast - with particular emphasis on the city of Anchorage - and Hawaii's is centered on the island of Oahu
tsunamis; volcanoes; earthquake activity around Pacific Basin; hurricanes along the Atlantic and Gulf of Mexico coasts; tornadoes in the Midwest and Southeast; mud slides in California; forest fires in the west; flooding; permafrost in northern Alaska, a major impediment to development
volcanism: volcanic activity in the Hawaiian Islands, Western Alaska, the Pacific Northwest, and in the Northern Mariana Islands; both Mauna Loa (4,170 m) in Hawaii and Mount Rainier (4,392 m) in Washington have been deemed Decade Volcanoes by the International Association of Volcanology and Chemistry of the Earth's Interior, worthy of study due to their explosive history and close proximity to human populations; Pavlof (2,519 m) is the most active volcano in Alaska's Aleutian Arc and poses a significant threat to air travel since the area constitutes a major flight path between North America and East Asia; St. Helens (2,549 m), famous for the devastating 1980 eruption, remains active today; numerous other historically active volcanoes exist, mostly concentrated in the Aleutian arc and Hawaii; they include: in Alaska: Aniakchak, Augustine, Chiginagak, Fourpeaked, Iliamna, Katmai, Kupreanof, Martin, Novarupta, Redoubt, Spurr, Wrangell, Trident, Ugashik-Peulik, Ukinrek Maars, Veniaminof; in Hawaii: Haleakala, Kilauea, Loihi; in the Northern Mariana Islands: Anatahan; and in the Pacific Northwest: Mount Baker, Mount Hood; see note 2 under "Geography - note"
air pollution; large emitter of carbon dioxide from the burning of fossil fuels; water pollution from runoff of pesticides and fertilizers; limited natural freshwater resources in much of the western part of the country require careful management; deforestation; mining; desertification; species conservation; invasive species (the Hawaiian Islands are particularly vulnerable)
party to: Air Pollution, Air Pollution-Nitrogen Oxides, Antarctic-Environmental Protocol, Antarctic-Marine Living Resources, Antarctic Seals, Antarctic Treaty, Climate Change, Desertification, Endangered Species, Environmental Modification, Marine Dumping, Marine Life Conservation, Ozone Layer Protection, Ship Pollution, Tropical Timber 83, Tropical Timber 94, Wetlands, Whalingsigned, but not ratified: Air Pollution-Persistent Organic Pollutants, Air Pollution-Volatile Organic Compounds, Biodiversity, Climate Change-Kyoto Protocol, Hazardous Wastes
note 1: world's third-largest country by size (after Russia and Canada) and by population (after China and India); Denali (Mt. McKinley) is the highest point in North America and Death Valley the lowest point on the continent
note 2: the western coast of the United States and southern coast of Alaska lie along the Ring of Fire, a belt of active volcanoes and earthquake epicenters bordering the Pacific Ocean; up to 90% of the world's earthquakes and some 75% of the world's volcanoes occur within the Ring of Fire
note 3: the Aleutian Islands are a chain of volcanic islands that divide the Bering Sea (north) from the main Pacific Ocean (south); they extend about 1,800 km westward from the Alaskan Peninsula; the archipelago consists of 14 larger islands, 55 smaller islands, and hundreds of islets; there are 41 active volcanoes on the islands, which together form a large northern section of the Ring of Fire
note 4: Mammoth Cave, in west-central Kentucky, is the world's longest known cave system with more than 650 km (405 miles) of surveyed passageways, which is nearly twice as long as the second-longest cave system, the Sac Actun underwater cave in Mexico - the world's longest underwater cave system (see "Geography - note" under Mexico);
note 5: Kazumura Cave on the island of Hawaii is the world's longest and deepest lava tube cave; it has been surveyed at 66 km (41 mi) long and 1,102 m (3,614 ft) deep
note 6: Bracken Cave outside of San Antonio, Texas is the world's largest bat cave; it is the summer home to the largest colony of bats in the world; an estimated 20 million Mexican free-tailed bats roost in the cave from March to October making it the world's largest known concentration of mammals -
People and Society :: United States
-
332,639,102 (July 2020 est.)country comparison to the world: 3
noun: American(s)adjective: American
White 72.4%, Black 12.6%, Asian 4.8%, Amerindian and Alaska native 0.9%, native Hawaiian and other Pacific islander 0.2%, other 6.2%, two or more races 2.9% (2010 est.)
note: a separate listing for Hispanic is not included because the US Census Bureau considers Hispanic to mean persons of Spanish/Hispanic/Latino origin including those of Mexican, Cuban, Puerto Rican, Dominican Republic, Spanish, and Central or South American origin living in the US who may be of any race or ethnic group (white, black, Asian, etc.); an estimated 16.3% of the total US population is Hispanic as of 2010
English only 78.2%, Spanish 13.4%, Chinese 1.1%, other 7.3% (2017 est.)note: data represent the language spoken at home; the US has no official national language, but English has acquired official status in 32 of the 50 states; Hawaiian is an official language in the state of Hawaii, and 20 indigenous languages are official in Alaska
Protestant 46.5%, Roman Catholic 20.8%, Jewish 1.9%, Mormon 1.6%, other Christian 0.9%, Muslim 0.9%, Jehovah's Witness 0.8%, Buddhist 0.7%, Hindu 0.7%, other 1.8%, unaffiliated 22.8%, don't know/refused 0.6% (2014 est.)
0-14 years: 18.46% (male 31,374,555/female 30,034,371)15-24 years: 12.91% (male 21,931,368/female 21,006,463)25-54 years: 38.92% (male 64,893,670/female 64,564,565)55-64 years: 12.86% (male 20,690,736/female 22,091,808)65 years and over: 16.85% (male 25,014,147/female 31,037,419) (2020 est.)population pyramid : The World Factbook Field Image ModalNorth America :: United States Print
 Image DescriptionThis is the population pyramid for the United States. A population pyramid illustrates the age and sex structure of a country's population and may provide insights about political and social stability, as well as economic development. The population is distributed along the horizontal axis, with males shown on the left and females on the right. The male and female populations are broken down into 5-year age groups represented as horizontal bars along the vertical axis, with the youngest age groups at the bottom and the oldest at the top. The shape of the population pyramid gradually evolves over time based on fertility, mortality, and international migration trends.
For additional information, please see the entry for Population pyramid on the Definitions and Notes page under the References tab.
total dependency ratio: 53.9youth dependency ratio: 28.3elderly dependency ratio: 25.6potential support ratio: 3.9 (2020 est.)
total: 38.5 yearsmale: 37.2 yearsfemale: 39.8 years (2020 est.)country comparison to the world: 61
0.72% (2020 est.)country comparison to the world: 136
12.4 births/1,000 population (2020 est.)country comparison to the world: 156
8.3 deaths/1,000 population (2020 est.)country comparison to the world: 83
3 migrant(s)/1,000 population (2020 est.)country comparison to the world: 36
large urban clusters are spread throughout the eastern half of the US (particularly the Great Lakes area, northeast, east, and southeast) and the western tier states; mountainous areas, principally the Rocky Mountains and Appalachian chain, deserts in the southwest, the dense boreal forests in the extreme north, and the central prarie states are less densely populated; Alaska's population is concentrated along its southern coast - with particular emphasis on the city of Anchorage - and Hawaii's is centered on the island of Oahu
urban population: 82.7% of total population (2020)rate of urbanization: 0.95% annual rate of change (2015-20 est.)total population growth rate v. urban population growth rate, 2000-2030: PDF
18.804 million New York-Newark, 12.447 million Los Angeles-Long Beach-Santa Ana, 8.865 million Chicago, 6.371 million Houston, 6.301 million Dallas-Fort Worth, 5.322 million WASHINGTON, D.C. (capital) (2020)
at birth: 1.05 male(s)/female NA0-14 years: 1.04 male(s)/female15-24 years: 1.04 male(s)/female25-54 years: 1.01 male(s)/female55-64 years: 0.94 male(s)/female65 years and over: 0.81 male(s)/femaletotal population: 0.97 male(s)/female (2020 est.)
26.4 years (2015 est.)
19 deaths/100,000 live births (2017 est.)country comparison to the world: 129
total: 5.3 deaths/1,000 live birthsmale: 5.7 deaths/1,000 live birthsfemale: 4.9 deaths/1,000 live births (2020 est.)country comparison to the world: 173
total population: 80.3 yearsmale: 78 yearsfemale: 82.5 years (2020 est.)country comparison to the world: 45
1.84 children born/woman (2020 est.)country comparison to the world: 141
75.9% (2015/17)
improved: urban: 100% of populationrural: 97% of populationtotal: 99% of populationunimproved: urban: 0% of populationrural: 3% of populationtotal: 1% of population (2017 est.)
17.1% (2017)
2.61 physicians/1,000 population (2017)
improved: urban: 100% of populationrural: 100% of populationtotal: 100% of populationunimproved: urban: 0% of populationrural: 0% of populationtotal: 0% of population (2017 est.)
NA
NA
NA
36.2% (2016)country comparison to the world: 12
0.5% (2012)country comparison to the world: 131
5% of GDP (2014)country comparison to the world: 61
total: 16 yearsmale: 16 yearsfemale: 17 years (2018)
-
Government :: United States
-
conventional long form: United States of Americaconventional short form: United Statesabbreviation: US or USAetymology: the name America is derived from that of Amerigo VESPUCCI (1454-1512) - Italian explorer, navigator, and cartographer - using the Latin form of his name, Americus, feminized to America
constitutional federal republic
name: Washington, DCgeographic coordinates: 38 53 N, 77 02 Wtime difference: UTC-5 (during Standard Time)daylight saving time: +1hr, begins second Sunday in March; ends first Sunday in November
note: the 50 United States cover six time zones
etymology: named after George Washington (1732-1799), the first president of the United States
50 states and 1 district*; Alabama, Alaska, Arizona, Arkansas, California, Colorado, Connecticut, Delaware, District of Columbia*, Florida, Georgia, Hawaii, Idaho, Illinois, Indiana, Iowa, Kansas, Kentucky, Louisiana, Maine, Maryland, Massachusetts, Michigan, Minnesota, Mississippi, Missouri, Montana, Nebraska, Nevada, New Hampshire, New Jersey, New Mexico, New York, North Carolina, North Dakota, Ohio, Oklahoma, Oregon, Pennsylvania, Rhode Island, South Carolina, South Dakota, Tennessee, Texas, Utah, Vermont, Virginia, Washington, West Virginia, Wisconsin, Wyoming
American Samoa, Baker Island, Guam, Howland Island, Jarvis Island, Johnston Atoll, Kingman Reef, Midway Islands, Navassa Island, Northern Mariana Islands, Palmyra Atoll, Puerto Rico, Virgin Islands, Wake Islandnote: from 18 July 1947 until 1 October 1994, the US administered the Trust Territory of the Pacific Islands; it entered into a political relationship with all four political entities: the Northern Mariana Islands is a commonwealth in political union with the US (effective 3 November 1986); the Republic of the Marshall Islands signed a Compact of Free Association with the US (effective 21 October 1986); the Federated States of Micronesia signed a Compact of Free Association with the US (effective 3 November 1986); Palau concluded a Compact of Free Association with the US (effective 1 October 1994)
4 July 1776 (declared independence from Great Britain); 3 September 1783 (recognized by Great Britain)
Independence Day, 4 July (1776)
history: previous 1781 (Articles of Confederation and Perpetual Union); latest drafted July - September 1787, submitted to the Congress of the Confederation 20 September 1787, submitted for states' ratification 28 September 1787, ratification completed by nine of the 13 states 21 June 1788, effective 4 March 1789amendments: proposed as a "joint resolution" by Congress, which requires a two-thirds majority vote in both the House of Representatives and the Senate or by a constitutional convention called for by at least two thirds of the state legislatures; passage requires ratification by three fourths of the state legislatures or passage in state-held constitutional conventions as specified by Congress; the US president has no role in the constitutional amendment process; amended many times, last in 1992
common law system based on English common law at the federal level; state legal systems based on common law, except Louisiana, where state law is based on Napoleonic civil code; judicial review of legislative acts
withdrew acceptance of compulsory ICJ jurisdiction in 2005; withdrew acceptance of ICCt jurisdiction in 2002
citizenship by birth: yescitizenship by descent only: yesdual citizenship recognized: no, but the US government acknowledges such situtations exist; US citizens are not encouraged to seek dual citizenship since it limits protection by the USresidency requirement for naturalization: 5 years
18 years of age; universal
chief of state: President Donald J. TRUMP (since 20 January 2017); Vice President Michael R. PENCE (since 20 January 2017); note - the president is both chief of state and head of governmenthead of government: President Donald J. TRUMP (since 20 January 2017); Vice President Michael R. PENCE (since 20 January 2017)cabinet: Cabinet appointed by the president, approved by the Senateelections/appointments: president and vice president indirectly elected on the same ballot by the Electoral College of 'electors' chosen from each state; president and vice president serve a 4-year term (eligible for a second term); election last held on 8 November 2016 (next to be held on 3 November 2020)election results: Donald J. TRUMP elected president; electoral vote - Donald J. TRUMP (Republican Party) 304, Hillary D. CLINTON (Democratic Party) 227, other 7; percent of direct popular vote - Hillary D. CLINTON 48.2%, Donald J. TRUMP 46.1%, other 5.7%
description: bicameral Congress consists of:
Senate (100 seats; 2 members directly elected in each of the 50 state constituencies by simple majority vote except in Georgia and Louisiana which require an absolute majority vote with a second round if needed; members serve 6-year terms with one-third of membership renewed every 2 years)
House of Representatives (435 seats; members directly elected in single-seat constituencies by simple majority vote except in Georgia which requires an absolute majority vote with a second round if needed; members serve 2-year terms)elections:
Senate - last held on 6 November 2018 (next to be held on 3 November 2020)
House of Representatives - last held on 6 November 2018 (next to be held on 3 November 2020)election results:
Senate - percent of vote by party - NA; seats by party - Republican Party 53, Democratic Party 45, independent 2; composition - men 75, women 25, percent of women 25%
House of Representatives - percent of vote by party - NA; seats by party - Democratic Party 234, Republican Party 200, 1 seat still undecided; composition - men 328, women 106, percent of women 24.4%; note - total US Congress percent of women 24.5%note: in addition to the regular members of the House of Representatives there are 6 non-voting delegates elected from the District of Columbia and the US territories of American Samoa, Guam, Puerto Rico, the Northern Mariana Islands, and the Virgin Islands; these are single seat constituencies directly elected by simple majority vote to serve a 2-year term (except for the resident commissioner of Puerto Rico who serves a 4-year term); the delegate can vote when serving on a committee and when the House meets as the Committee of the Whole House, but not when legislation is submitted for a “full floor” House vote; election of delegates last held on 6 November 2018 (next to be held on 3 November 2020)
highest courts: US Supreme Court (consists of 9 justices - the chief justice and 8 associate justices)judge selection and term of office: president nominates and, with the advice and consent of the Senate, appoints Supreme Court justices; justices serve for lifesubordinate courts: Courts of Appeal (includes the US Court of Appeal for the Federal District and 12 regional appeals courts); 94 federal district courts in 50 states and territoriesnote: the US court system consists of the federal court system and the state court systems; although each court system is responsible for hearing certain types of cases, neither is completely independent of the other, and the systems often interact
Democratic Party [Tom PEREZ]
Green Party [collective leadership]
Libertarian Party [Nicholas SARWARK]
Republican Party [Ronna Romney MCDANIEL]
ADB (nonregional member), AfDB (nonregional member), ANZUS, APEC, Arctic Council, ARF, ASEAN (dialogue partner), Australia Group, BIS, BSEC (observer), CBSS (observer), CD, CE (observer), CERN (observer), CICA (observer), CP, EAPC, EAS, EBRD, EITI (implementing country), FAO, FATF, G-5, G-7, G-8, G-10, G-20, IADB, IAEA, IBRD, ICAO, ICC (national committees), ICRM, IDA, IEA, IFAD, IFC, IFRCS, IGAD (partners), IHO, ILO, IMF, IMO, IMSO, Interpol, IOC, IOM, ISO, ITSO, ITU, ITUC (NGOs), MIGA, MINUSMA, MINUSTAH, MONUSCO, NAFTA, NATO, NEA, NSG, OAS, OECD, OPCW, OSCE, Pacific Alliance (observer), Paris Club, PCA, PIF (partner), SAARC (observer), SELEC (observer), SICA (observer), SPC, UN, UNCTAD, UNESCO, UNHCR, UNITAR, UNMIL, UNMISS, UNRWA, UN Security Council (permanent), UNTSO, UPU, WCO, WIPO, WMO, WTO, ZC
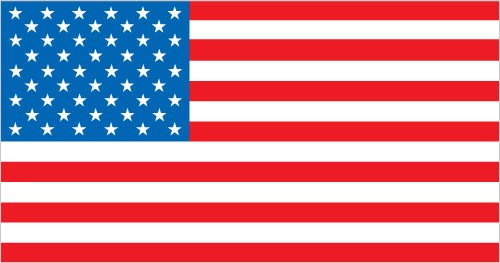
13 equal horizontal stripes of red (top and bottom) alternating with white; there is a blue rectangle in the upper hoist-side corner bearing 50 small, white, five-pointed stars arranged in nine offset horizontal rows of six stars (top and bottom) alternating with rows of five stars; the 50 stars represent the 50 states, the 13 stripes represent the 13 original colonies; blue stands for loyalty, devotion, truth, justice, and friendship, red symbolizes courage, zeal, and fervency, while white denotes purity and rectitude of conduct; commonly referred to by its nickname of Old Glorynote: the design and colors have been the basis for a number of other flags, including Chile, Liberia, Malaysia, and Puerto Rico
bald eagle; national colors: red, white, blue
name: The Star-Spangled Bannerlyrics/music: Francis Scott KEY/John Stafford SMITHnote: adopted 1931; during the War of 1812, after witnessing the successful American defense of Fort McHenry in Baltimore following British naval bombardment, Francis Scott KEY wrote the lyrics to what would become the national anthem; the lyrics were set to the tune of "The Anacreontic Song"; only the first verse is sung
-
Economy :: United States
-
The US has the most technologically powerful economy in the world, with a per capita GDP of $59,500. US firms are at or near the forefront in technological advances, especially in computers, pharmaceuticals, and medical, aerospace, and military equipment; however, their advantage has narrowed since the end of World War II. Based on a comparison of GDP measured at purchasing power parity conversion rates, the US economy in 2014, having stood as the largest in the world for more than a century, slipped into second place behind China, which has more than tripled the US growth rate for each year of the past four decades.
In the US, private individuals and business firms make most of the decisions, and the federal and state governments buy needed goods and services predominantly in the private marketplace. US business firms enjoy greater flexibility than their counterparts in Western Europe and Japan in decisions to expand capital plant, to lay off surplus workers, and to develop new products. At the same time, businesses face higher barriers to enter their rivals' home markets than foreign firms face entering US markets.
Long-term problems for the US include stagnation of wages for lower-income families, inadequate investment in deteriorating infrastructure, rapidly rising medical and pension costs of an aging population, energy shortages, and sizable current account and budget deficits.
The onrush of technology has been a driving factor in the gradual development of a "two-tier" labor market in which those at the bottom lack the education and the professional/technical skills of those at the top and, more and more, fail to get comparable pay raises, health insurance coverage, and other benefits. But the globalization of trade, and especially the rise of low-wage producers such as China, has put additional downward pressure on wages and upward pressure on the return to capital. Since 1975, practically all the gains in household income have gone to the top 20% of households. Since 1996, dividends and capital gains have grown faster than wages or any other category of after-tax income.
Imported oil accounts for more than 50% of US consumption and oil has a major impact on the overall health of the economy. Crude oil prices doubled between 2001 and 2006, the year home prices peaked; higher gasoline prices ate into consumers' budgets and many individuals fell behind in their mortgage payments. Oil prices climbed another 50% between 2006 and 2008, and bank foreclosures more than doubled in the same period. Besides dampening the housing market, soaring oil prices caused a drop in the value of the dollar and a deterioration in the US merchandise trade deficit, which peaked at $840 billion in 2008. Because the US economy is energy-intensive, falling oil prices since 2013 have alleviated many of the problems the earlier increases had created.
The sub-prime mortgage crisis, falling home prices, investment bank failures, tight credit, and the global economic downturn pushed the US into a recession by mid-2008. GDP contracted until the third quarter of 2009, the deepest and longest downturn since the Great Depression. To help stabilize financial markets, the US Congress established a $700 billion Troubled Asset Relief Program in October 2008. The government used some of these funds to purchase equity in US banks and industrial corporations, much of which had been returned to the government by early 2011. In January 2009, Congress passed and former President Barack OBAMA signed a bill providing an additional $787 billion fiscal stimulus to be used over 10 years - two-thirds on additional spending and one-third on tax cuts - to create jobs and to help the economy recover. In 2010 and 2011, the federal budget deficit reached nearly 9% of GDP. In 2012, the Federal Government reduced the growth of spending and the deficit shrank to 7.6% of GDP. US revenues from taxes and other sources are lower, as a percentage of GDP, than those of most other countries.
Wars in Iraq and Afghanistan required major shifts in national resources from civilian to military purposes and contributed to the growth of the budget deficit and public debt. Through FY 2018, the direct costs of the wars will have totaled more than $1.9 trillion, according to US Government figures.
In March 2010, former President OBAMA signed into law the Patient Protection and Affordable Care Act (ACA), a health insurance reform that was designed to extend coverage to an additional 32 million Americans by 2016, through private health insurance for the general population and Medicaid for the impoverished. Total spending on healthcare - public plus private - rose from 9.0% of GDP in 1980 to 17.9% in 2010.
In July 2010, the former president signed the DODD-FRANK Wall Street Reform and Consumer Protection Act, a law designed to promote financial stability by protecting consumers from financial abuses, ending taxpayer bailouts of financial firms, dealing with troubled banks that are "too big to fail," and improving accountability and transparency in the financial system - in particular, by requiring certain financial derivatives to be traded in markets that are subject to government regulation and oversight.
The Federal Reserve Board (Fed) announced plans in December 2012 to purchase $85 billion per month of mortgage-backed and Treasury securities in an effort to hold down long-term interest rates, and to keep short-term rates near zero until unemployment dropped below 6.5% or inflation rose above 2.5%. The Fed ended its purchases during the summer of 2014, after the unemployment rate dropped to 6.2%, inflation stood at 1.7%, and public debt fell below 74% of GDP. In December 2015, the Fed raised its target for the benchmark federal funds rate by 0.25%, the first increase since the recession began. With continued low growth, the Fed opted to raise rates several times since then, and in December 2017, the target rate stood at 1.5%.
In December 2017, Congress passed and President Donald TRUMP signed the Tax Cuts and Jobs Act, which, among its various provisions, reduces the corporate tax rate from 35% to 21%; lowers the individual tax rate for those with the highest incomes from 39.6% to 37%, and by lesser percentages for those at lower income levels; changes many deductions and credits used to calculate taxable income; and eliminates in 2019 the penalty imposed on taxpayers who do not obtain the minimum amount of health insurance required under the ACA. The new taxes took effect on 1 January 2018; the tax cut for corporations are permanent, but those for individuals are scheduled to expire after 2025. The Joint Committee on Taxation (JCT) under the Congressional Budget Office estimates that the new law will reduce tax revenues and increase the federal deficit by about $1.45 trillion over the 2018-2027 period. This amount would decline if economic growth were to exceed the JCT’s estimate.
Fitch rating: AAA (1994)Moody's rating: Aaa (1949)Standard & Poors rating: AA+ (2011)
$18,349,107,000,000 (2019 est.)$17,960,939,000,000 (2018 est.)$17,438,404,000,000 (2017 est.)note: data are in 2010 dollars
$21,433,228,000,000 (2019 est.)
$55,761 (2019 est.)$54,910 (2018 est.)$53,643 (2017 est.)note: data are in 2010 dollars
country comparison to the world: 23
18.9% of GDP (2017 est.)18.6% of GDP (2016 est.)20.1% of GDP (2015 est.)country comparison to the world: 106
agriculture: 0.9% (2017 est.)industry: 19.1% (2017 est.)services: 80% (2017 est.)
household consumption: 68.4% (2017 est.)government consumption: 17.3% (2017 est.)investment in fixed capital: 17.2% (2017 est.)investment in inventories: 0.1% (2017 est.)exports of goods and services: 12.1% (2017 est.)imports of goods and services: -15% (2017 est.)
92.0 (2020)
wheat, corn, other grains, fruits, vegetables, cotton; beef, pork, poultry, dairy products; fish; forest products
highly diversified, world leading, high-technology innovator, second-largest industrial output in the world; petroleum, steel, motor vehicles, aerospace, telecommunications, chemicals, electronics, food processing, consumer goods, lumber, mining
2.3% (2017 est.)country comparison to the world: 122
agriculture: 0.7% (2009)industry: 20.3% (2009)services: 37.3% (2009)industry and services: 24.2% (2009)manufacturing: 17.6% (2009)farming, forestry, and fishing: 0.7% (2009)manufacturing, extraction, transportation, and crafts: 20.3% (2009)managerial, professional, and technical: 37.3% (2009)sales and office: 24.2% (2009)other services: 17.6% (2009)note: figures exclude the unemployed
15.1% (2010 est.)
revenues: 3.315 trillion (2017 est.)expenditures: 3.981 trillion (2017 est.)note: revenues exclude social contributions of approximately $1.0 trillion; expenditures exclude social benefits of approximately $2.3 trillion
17% (of GDP) (2017 est.)note: excludes contributions for social security and other programs; if social contributions were added, taxes and other revenues would amount to approximately 22% of GDP
country comparison to the world: 172
-3.4% (of GDP) (2017 est.)country comparison to the world: 145
78.8% of GDP (2017 est.)81.2% of GDP (2016 est.)note: data cover only what the United States Treasury denotes as "Debt Held by the Public," which includes all debt instruments issued by the Treasury that are owned by non-US Government entities; the data include Treasury debt held by foreign entities; the data exclude debt issued by individual US states, as well as intragovernmental debt; intragovernmental debt consists of Treasury borrowings from surpluses in the trusts for Federal Social Security, Federal Employees, Hospital and Supplemental Medical Insurance (Medicare), Disability and Unemployment, and several other smaller trusts; if data for intragovernment debt were added, "gross debt" would increase by about one-third of GDP
country comparison to the world: 36
1 October - 30 September
$2,377,156,000,000 (2019 est.)$2,379,936,000,000 (2018 est.)$2,310,851,000,000 (2017 est.)country comparison to the world: 2
Canada 18.3%, Mexico 15.7%, China 8.4%, Japan 4.4% (2017)
agricultural products (soybeans, fruit, corn) 9.2%, industrial supplies (organic chemicals) 26.8%, capital goods (transistors, aircraft, motor vehicle parts, computers, telecommunications equipment) 49.0%, consumer goods (automobiles, medicines) 15.0% (2008 est.)
$3,214,184,000,000 (2019 est.)$3,179,875,000,000 (2018 est.)$3,054,759,000,000 (2017 est.)country comparison to the world: 1
agricultural products 4.9%, industrial supplies 32.9% (crude oil 8.2%), capital goods 30.4% (computers, telecommunications equipment, motor vehicle parts, office machines, electric power machinery), consumer goods 31.8% (automobiles, clothing, medicines, furniture, toys) (2008 est.)
China 21.6%, Mexico 13.4%, Canada 12.8%, Japan 5.8%, Germany 5% (2017)
$123.3 billion (31 December 2017 est.)$117.6 billion (31 December 2015 est.)country comparison to the world: 20
$17.91 trillion (31 March 2016 est.)$17.85 trillion (31 March 2015 est.)note: approximately 4/5ths of US external debt is denominated in US dollars; foreign lenders have been willing to hold US dollar denominated debt instruments because they view the dollar as the world's reserve currencycountry comparison to the world: 1
British pounds per US dollar: 0.7836 (2017 est.), 0.738 (2016 est.), 0.738 (2015 est.), 0.607 (2014 est), 0.6391 (2013 est.)
Canadian dollars per US dollar: 1, 1.308 (2017 est.), 1.3256 (2016 est.), 1.3256 (2015 est.), 1.2788 (2014 est.), 1.0298 (2013 est.)
Chinese yuan per US dollar: 1, 6.7588 (2017 est.), 6.6445 (2016 est.), 6.2275 (2015 est.), 6.1434 (2014 est.), 6.1958 (2013 est.)
euros per US dollar: 0.885 (2017 est.), 0.903 (2016 est.), 0.9214(2015 est.), 0.885 (2014 est.), 0.7634 (2013 est.)
Japanese yen per US dollar: 111.10 (2017 est.), 108.76 (2016 est.), 108.76 (2015 est.), 121.02 (2014 est.), 97.44 (2013 est.) -
Energy :: United States
-
electrification - total population: 100% (2020)
4.095 trillion kWh (2016 est.)country comparison to the world: 2
3.902 trillion kWh (2016 est.)country comparison to the world: 2
9.695 billion kWh (2016 est.)country comparison to the world: 22
72.72 billion kWh (2016 est.)country comparison to the world: 1
1.087 billion kW (2016 est.)country comparison to the world: 2
70% of total installed capacity (2016 est.)country comparison to the world: 110
9% of total installed capacity (2017 est.)country comparison to the world: 18
7% of total installed capacity (2017 est.)country comparison to the world: 128
14% of total installed capacity (2017 est.)country comparison to the world: 65
10.962 million bbl/day (2018 est.)country comparison to the world: 1
1.158 million bbl/day (2017 est.)country comparison to the world: 12
7.969 million bbl/day (2017 est.)country comparison to the world: 1
NA bbl (1 January 2018 est.)
20.3 million bbl/day (2017 est.)country comparison to the world: 1
19.96 million bbl/day (2017 est.)country comparison to the world: 1
5.218 million bbl/day (2017 est.)country comparison to the world: 1
2.175 million bbl/day (2017 est.)country comparison to the world: 2
772.8 billion cu m (2017 est.)country comparison to the world: 1
767.6 billion cu m (2017 est.)country comparison to the world: 1
89.7 billion cu m (2017 est.)country comparison to the world: 4
86.15 billion cu m (2017 est.)country comparison to the world: 4
0 cu m (1 January 2017 est.)country comparison to the world: 203
5.242 billion Mt (2017 est.)country comparison to the world: 2
-
Communications :: United States
-
total subscriptions: 107,667,642subscriptions per 100 inhabitants: 32.6 (2019 est.)country comparison to the world: 2
total subscriptions: 408,509,528subscriptions per 100 inhabitants: 123.69 (2019 est.)country comparison to the world: 3
general assessment: a large, technologically advanced, multipurpose communications system; mobile subscriber penetration rate of about 129%; national LTE-M services, closes down 2G infrastructure and reassigns spectrum for 5G; FttP rather than FttN efforts (2020)domestic: a large system of fiber-optic cable, microwave radio relay, coaxial cable, and domestic satellites carries every form of telephone traffic; a rapidly growing cellular system carries mobile telephone traffic throughout the country; fixed-line 33 per 100 and mobile-cellular 124 per 100 (2019)international: country code - 1; landing points for the Quintillion Subsea Cable Network, TERRA SW, AU-Aleutian, KKFL, AKORN, Alaska United -West, & -East & -Southeast, North Star, Lynn Canal Fiber, KetchCar 1, PC-1, SCCN, Tat TGN-Pacific & -Atlantic, Jupiter, Hawaiki, NCP, FASTER, HKA, JUS, AAG, BtoBE, Currie, Southern Cross NEXT, SxS, PLCN, Utility EAC-Pacific, SEA-US, Paniolo Cable Network, HICS, HIFN, ASH, Telstra Endeavor, Honotua, AURORA, ARCOS, AMX-1, Americas -I & -II, Columbus IIb & -III, Maya-1, MAC, GTMO-1, BICS, CFX-1, GlobeNet, Monet, SAm-1, Bahamas 2, PCCS, BRUSA, Dunant, MAREA, SAE x1, TAT 14, Apollo, Gemini Bermuda, Havfrue/AEC-2, Seabras-1, WALL-LI, NYNJ-1, FLAG Atalantic-1, Yellow, Atlantic Crossing-1, AE Connect -1, sea2shore, Challenger Bermuda-1, and GTT Atlantic submarine cable systems providing international connectivity to Europe, Africa, the Middle East, Asia, Southeast Asia, Australia, New Zealand, Pacific, & Atlantic, and Indian Ocean Islands, Central and South America, Caribbean, Canada and US; satellite earth stations - 61 Intelsat (45 Atlantic Ocean and 16 Pacific Ocean), 5 Intersputnik (Atlantic Ocean region), and 4 Inmarsat (Pacific and Atlantic Ocean regions) (2020)note: the COVID-19 outbreak is negatively impacting telecommunications production and supply chains globally; consumer spending on telecom devices and services has also slowed due to the pandemic's effect on economies worldwide; overall progress towards improvements in all facets of the telecom industry - mobile, fixed-line, broadband, submarine cable and satellite - has moderated
4 major terrestrial TV networks with affiliate stations throughout the country, plus cable and satellite networks, independent stations, and a limited public broadcasting sector that is largely supported by private grants; overall, thousands of TV stations broadcasting; multiple national radio networks with many affiliate stations; while most stations are commercial, National Public Radio (NPR) has a network of some 900 member stations; satellite radio available; in total, over 15,000 radio stations operating (2018)
.us
total: 285,519,020percent of population: 87.27% (July 2018 est.)country comparison to the world: 3
total: 110.568 millionsubscriptions per 100 inhabitants: 34 (2018 est.)country comparison to the world: 2
note 1: The Library of Congress, Washington DC, USA, claims to be the largest library in the world with more than 167 million items (as of 2018); its collections are universal, not limited by subject, format, or national boundary, and include materials from all parts of the world and in over 450 languages; collections include: books, newspapers, magazines, sheet music, sound and video recordings, photographic images, artwork, architectural drawings, and copyright data
note 2: Cape Canaveral, Florida, USA, hosts one of four dedicated ground antennas that assist in the operation of the Global Positioning System (GPS) navigation system (the others are on Ascension (Saint Helena, Ascension, and Tistan da Cunha), Diego Garcia (British Indian Ocean Territory), and at Kwajalein (Marshall Islands) -
Transportation :: United States
-
number of registered air carriers: 99 (2020)inventory of registered aircraft operated by air carriers: 7,249annual passenger traffic on registered air carriers: 889.022 million (2018)annual freight traffic on registered air carriers: 42,985,300,000 mt-km (2018)
N (2016)
13,513 (2013)country comparison to the world: 1
total: 5,054 (2013)over 3,047 m: 189 (2013)2,438 to 3,047 m: 235 (2013)1,524 to 2,437 m: 1,478 (2013)914 to 1,523 m: 2,249 (2013)under 914 m: 903 (2013)
total: 8,459 (2013)over 3,047 m: 1 (2013)2,438 to 3,047 m: 6 (2013)1,524 to 2,437 m: 140 (2013)914 to 1,523 m: 1,552 (2013)under 914 m: 6,760 (2013)
5,287 (2013)
1,984,321 km natural gas, 240,711 km petroleum products (2013)
total: 293,564 km (2014)standard gauge: 293,564.2 km 1.435-m gauge (2014)country comparison to the world: 1
total: 6,586,610 km (2012)paved: 4,304,715 km (includes 76,334 km of expressways) (2012)unpaved: 2,281,895 km (2012)country comparison to the world: 1
41,009 km (19,312 km used for commerce; Saint Lawrence Seaway of 3,769 km, including the Saint Lawrence River of 3,058 km, is shared with Canada) (2012)country comparison to the world: 5
total: 3,673by type: bulk carrier 5, container ship 60, general cargo 104, oil tanker 68, other 3,436 (2019)country comparison to the world: 5
oil terminal(s): LOOP terminal, Haymark terminalcontainer port(s) (TEUs): Charleston (2,177,000), Hampton Roads (2,841,000), Houston (2,459,000), Long Beach (7,544,000), Los Angeles (9,343,000), New York/New Jersey (6,710,000), Oakland (2,420,000), Savannah (4,046,000), Seattle/Tacoma (3,665,000) (2017)LNG terminal(s) (export): Cameron (LA), Corpus Christi (TX), Cove Point (MD), Elba Island (GA), Freeport (TX), Sabine Pass (LA)
note - two additional export facilities are under construction and expected to begin commercial operations in 2023-2024LNG terminal(s) (import): Cove Point (MD), Elba Island (GA), Everett (MA), Freeport (TX), Golden Pass (TX), Hackberry (LA), Lake Charles (LA), Neptune (offshore), Northeast Gateway (offshore), Pascagoula (MS), Sabine Pass (TX)cargo ports: Baton Rouge, Corpus Christi, Hampton Roads, Houston, Long Beach, Los Angeles, New Orleans, New York, Plaquemines (LA), Tampa, Texas Citycruise departure ports (passengers): Miami (2,032,000), Port Everglades (1,277,000), Port Canaveral (1,189,000), Seattle (430,000), Long Beach (415,000) (2009) -
Military and Security :: United States
-
United States Armed Forces: US Army, US Navy (includes Marine Corps), US Air Force, US Space Force; US Coast Guard (administered in peacetime by the Department of Homeland Security, but in wartime reports to the Department of the Navy); National Guard (Army National Guard and Air National Guard); Reserves (all services) (2020)
3.42% of GDP (2019 est.)3.3% of GDP (2018)3.31% of GDP (2017)3.52% of GDP (2016)3.52% of GDP (2015)country comparison to the world: 20
the US Armed Forces have approximately 1.372 million active duty personnel (475,000 Army; 340,000 Navy; 330,000 Air Force; 185,000 Marine Corps); 42,000 Coast Guard; 335,000 Army National Guard; 105,000 Air National Guard (June 2020)
the US military's inventory is comprised almost entirely of domestically-produced weapons systems (some assembled with foreign components) along with a smaller mix of imported equipment from a variety of Western countries; since 2010, Germany and the UK are the leading suppliers, followed by Australia, Canada, France, the Netherlands, and Norway; the US defense industry is capable of designing, developing, maintaining, and producing the full spectrum of weapons systems (2019 est.)
4,500 Afghanistan (NATO; note - the US has pledged to further reduce the number of troops in Afghanistan by the end of 2020); 5,000 Africa (mostly in Djibouti with approximately 700 in Somalia and about 700 in West Africa); 1,000 Australia; 1,150 Belgium; 150 Bulgaria; 250 Diego Garcia; 150 Canada; 750 Cuba; 270 Egypt (MFO); 34,000 Germany (note - in July 2020, the US pledged to reduce the number of troops in Germany by about 12,000); 400 Greece; 150 Greenland; 6,000 Guam; 380 Honduras; 12,000 Italy; 54,000 Japan; 660 Kosovo (KFOR); approximately 10-15,000 assigned with an additional estimated 20-30,000 deployed in the Middle East (Bahrain/Iraq/Israel/Jordan/Kuwait/Oman/Qatar/Saudi Arabia/Syria/United Arab Emirates); 400 Netherlands; 700 Norway; 200 Philippines; 4,500 Poland; 250 Portugal; 26,500 Republic of Korea; 1,100 Romania; 200 Singapore; 3,200 Spain; 100 Thailand; 1,700 Turkey; 9,300 United Kingdom (2020)
US military rotational policies affect deployed numbers; for example, the US deploys ground and air units to select countries for 6-12 month rotational assignments on a continuous basis; in South Korea, for example, the US continuously rotates combat brigades (3,000-4,000 personnel) for 9 months at a time; contingencies also affect US troop deployments; for example, since May 2019, the US has deployed more than 15,000 additional military personnel to the Middle East for an undetermined period of time; in addition, some overseas US naval bases, such as the headquarters of US Naval Forces Central Command (USNAVCENT) in Manama, Bahrain, are frequented by the crews of US ships on 6-9 month deployments; a US carrier strike group with an air wing and supporting ships typically includes over 6,000 personnel (2020)
18 years of age (17 years of age with parental consent) for male and female voluntary service; no conscription; maximum enlistment age 34 (Army), 39 (Air Force), 39 (Navy), 28 (Marines), 31 (Coast Guard); 8-year service obligation, including 2-5 years active duty (Army), 2 years active (Navy), 4 years active (Air Force, Marines, Coast Guard); all military occupations and positions open to women (2019) -
Terrorism :: United States
-
Islamic Revolutionary Guard Corps/Qods Force; Islamic State of Iraq and ash-Sham; al-Qa'ida (2020)note: details about the history, aims, leadership, organization, areas of operation, tactics, targets, weapons, size, and sources of support of the group(s) appear(s) in Appendix-T
-
Transnational Issues :: United States
-
the US has intensified domestic security measures and is collaborating closely with its neighbors, Canada and Mexico, to monitor and control legal and illegal personnel, transport, and commodities across the international borders; abundant rainfall in recent years along much of the Mexico-US border region has ameliorated periodically strained water-sharing arrangements; 1990 Maritime Boundary Agreement in the Bering Sea still awaits Russian Duma ratification; Canada and the United States dispute how to divide the Beaufort Sea and the status of the Northwest Passage but continue to work cooperatively to survey the Arctic continental shelf; The Bahamas and US have not been able to agree on a maritime boundary; US Naval Base at Guantanamo Bay is leased from Cuba and only mutual agreement or US abandonment of the area can terminate the lease; Haiti claims US-administered Navassa Island; US has made no territorial claim in Antarctica (but has reserved the right to do so) and does not recognize the claims of any other states; Marshall Islands claims Wake Island; Tokelau included American Samoa's Swains Island among the islands listed in its 2006 draft constitution
refugees (country of origin): the US admitted 11,814 refugees during FY2020 including: 2,868 (Democratic Republic of the Congo), 2,115 (Burma), 1,927 (Ukraine), 604 (Afghanistan), 537 (Iraq)note: 72,722 Venezuelans have claimed asylum since 2014 because of the economic and political crisis (2018)
world's largest consumer of cocaine (shipped from Colombia through Mexico and the Caribbean), Colombian heroin, and Mexican heroin and marijuana; major consumer of ecstasy and Mexican methamphetamine; minor consumer of high-quality Southeast Asian heroin; illicit producer of cannabis, marijuana, depressants, stimulants, hallucinogens, and methamphetamine; money-laundering center
